Mass Incarceration: The Whole Pie 2016
Wait, does the United States have 1.4 million or more than 2 million people in prison? Are most people in state and federal prisons locked up for drug offenses? Frustrating questions like these abound because our systems of confinement are so fragmented and controlled by various entities. There is a lot of interesting and valuable research out there, but varying definitions make it hard — for both people new to criminal justice and for experienced policy wonks — to get the big picture.
This report offers some much needed clarity by piecing together this country’s disparate systems of confinement. The American criminal justice system holds more than 2.3 million people in 1,719 state prisons, 102 federal prisons, 942 juvenile correctional facilities, 3,283 local jails, and 79 Indian Country jails as well as in military prisons, immigration detention facilities, civil commitment centers, and prisons in the U.S. territories. And we go deeper to provide further detail on why convicted and not convicted people are locked up in local jails.
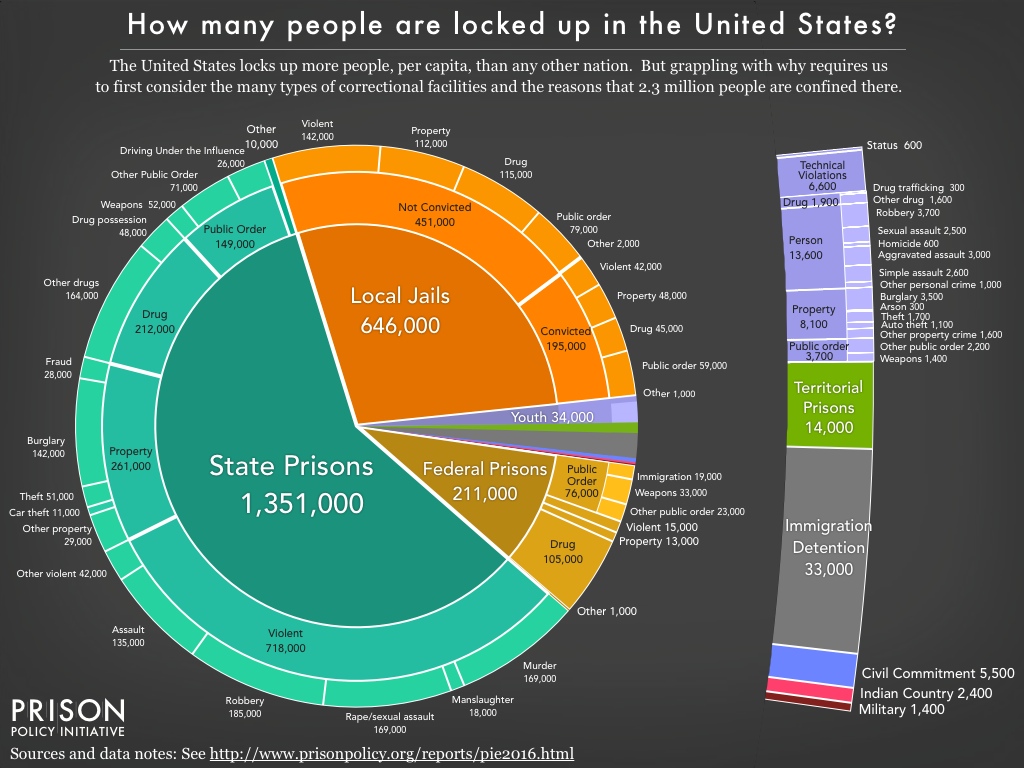
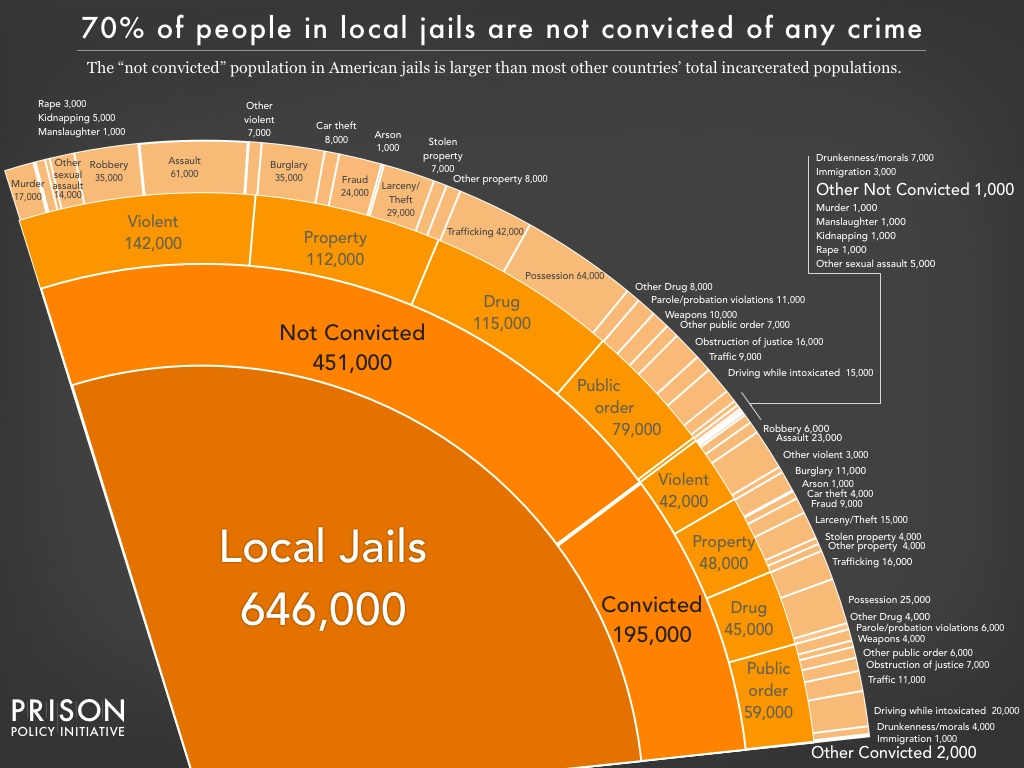
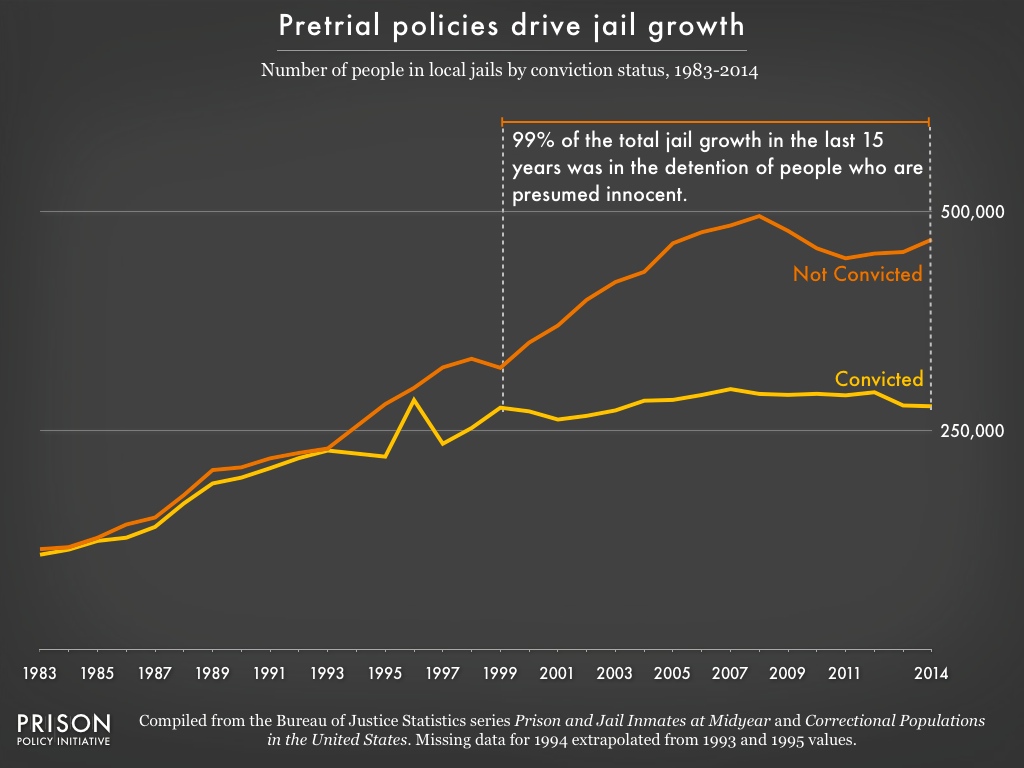
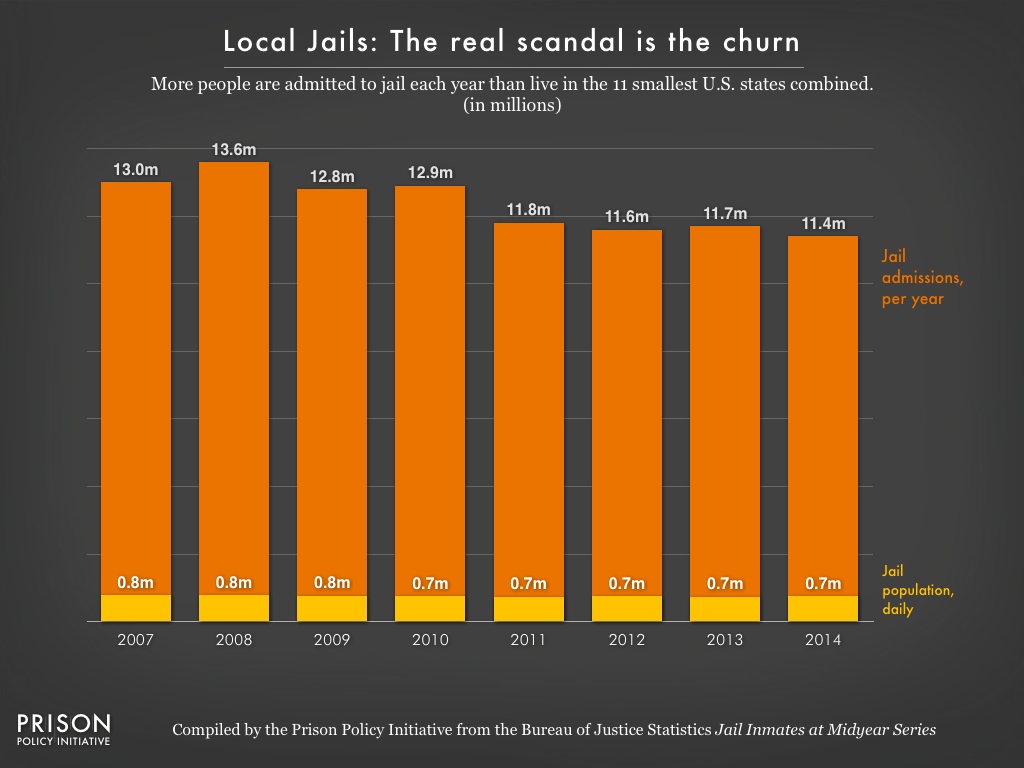
While this pie chart provides a comprehensive snapshot of our correctional system, the graphic does not capture the enormous churn in and out of our correctional facilities and the far larger universe of people whose lives are affected by the criminal justice system. Every year, 636,000 people walk out ofprison gates, but people go to jail over 11 million times each year. Jail churn is particularly high because most people in jails have not been convicted. Some have just been arrested and will make bail in the next few hours or days, and others are too poor to make bail and must remain behind bars until their trial. Only a small number (195,000) have been convicted, generally serving misdemeanors sentences under a year.
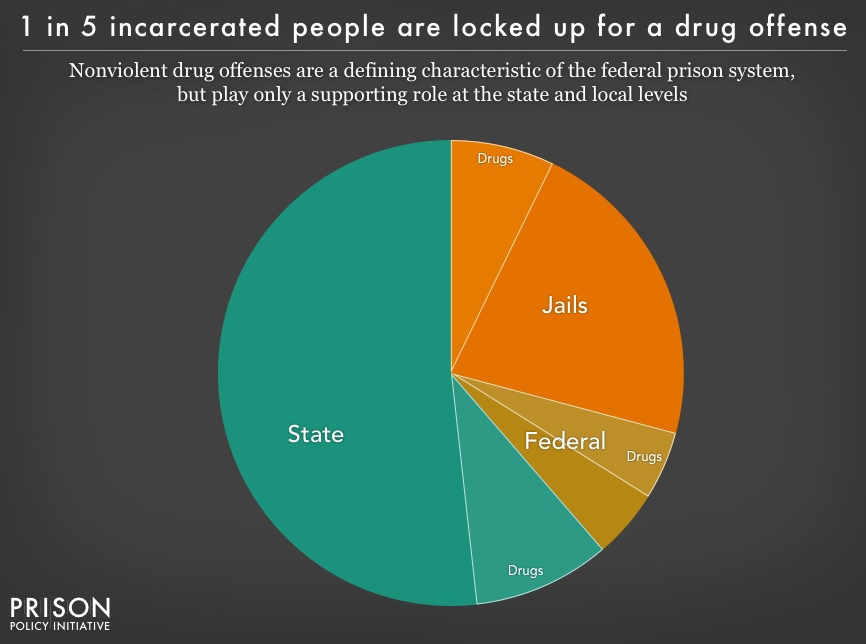
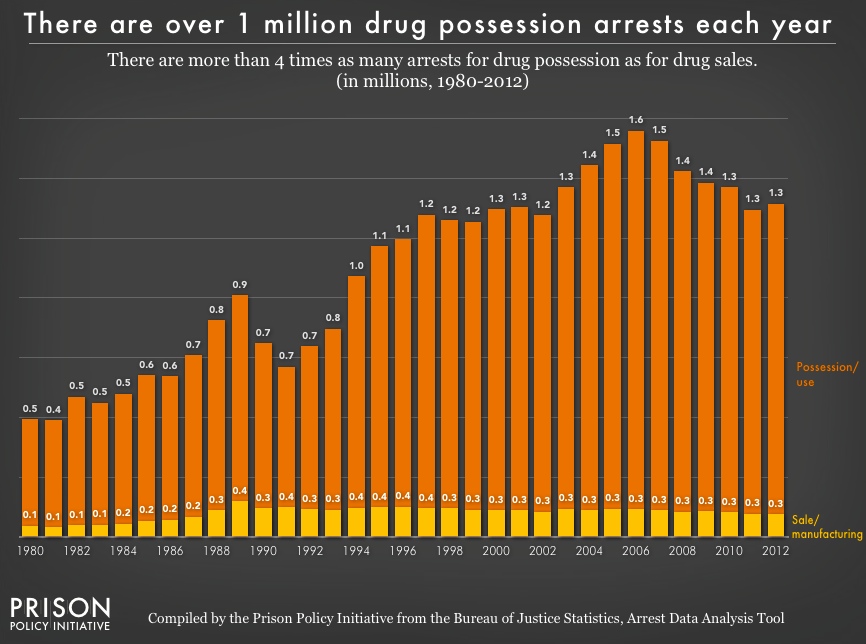
With a sense of the big picture, a common follow-up question might be: how many people are locked up for a drug offense? We know that almost half a million people are locked up because of a drug offense. The data confirms that nonviolent drug convictions are a defining characteristic of the federalprison system, but play only a supporting role at the state and local levels. While most people in state and local facilities are not locked up for drug offenses, most states’ continued practice of arresting people for drug possessiondestabilizes individual lives and communities. Drug arrests give residents of over-policed communities criminal records, which then reduce employment prospects and increase the likelihood of longer sentences for any future offenses.
All of the offense data presented comes with an important set of caveats. A person in prison for multiple offenses is reported only for the most serious offense so, for example, there are people in prison for “violent” offenseswho might have also been convicted of a drug offense. Further, almost all convictions are the result of plea bargains, where people plead guilty to a lesser offense, perhaps of a different category or one that they may not have actually committed.
And many of these categories group together people convicted of a wide range of offenses. For example, “murder” is generally considered to be an extremely serious offense, but “murder” groups together the rare group of serial killers, with people who committed acts that are unlikely for reasons of circumstance oradvanced age to ever happen again, with offenses that the average American may not consider to be murder at all. For example, the felony murder rule says that if someone dies during the commission of a felony, everyone involved is as guilty of murder as the person who pulled the trigger. Driving a getaway car during a bank robbery where someone was accidentally killed is indeed a serious offense, but few people would really consider that to be murder.
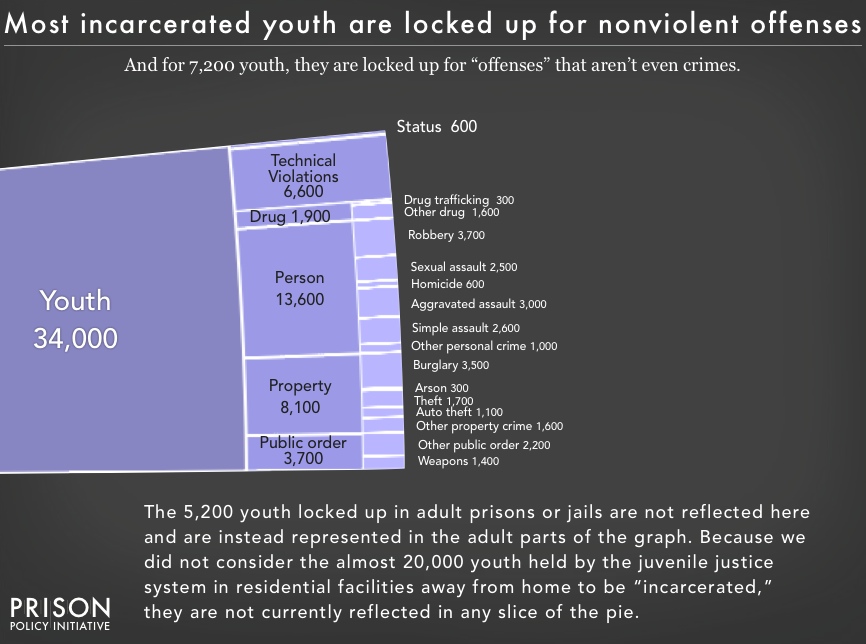
This “whole pie” methodology also exposes some disturbing facts about the youth entrapped in our juvenile justice system: Too many are there for a “most serious offense” that is not even a crime. For example, there are almost 7,000 youth behind bars for “technical violations” of the requirements of their probation, rather than for a new offense. Further, 600 youth are behind bars for“status” offenses, which are “behaviors that are not law violations for adults, such as running away, truancy, and incorrigibility.”
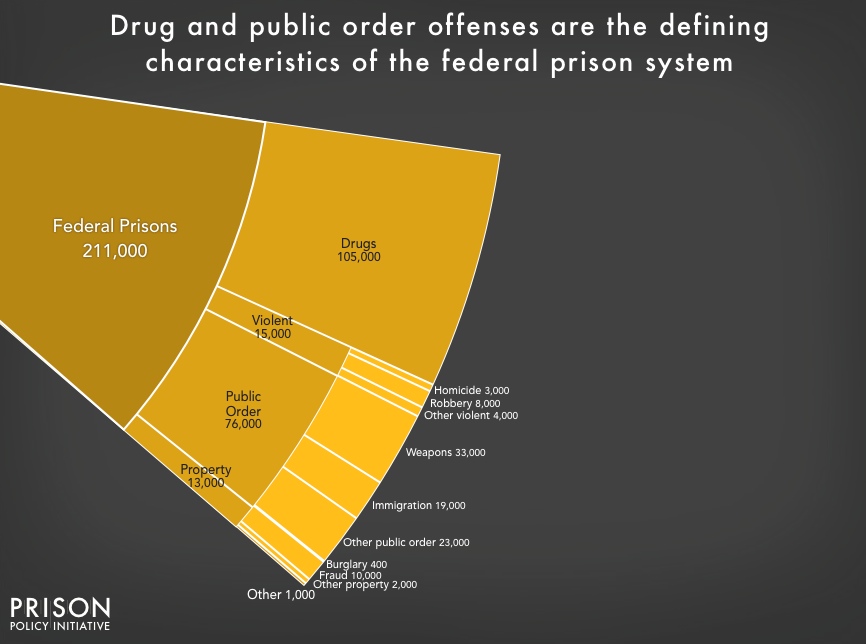
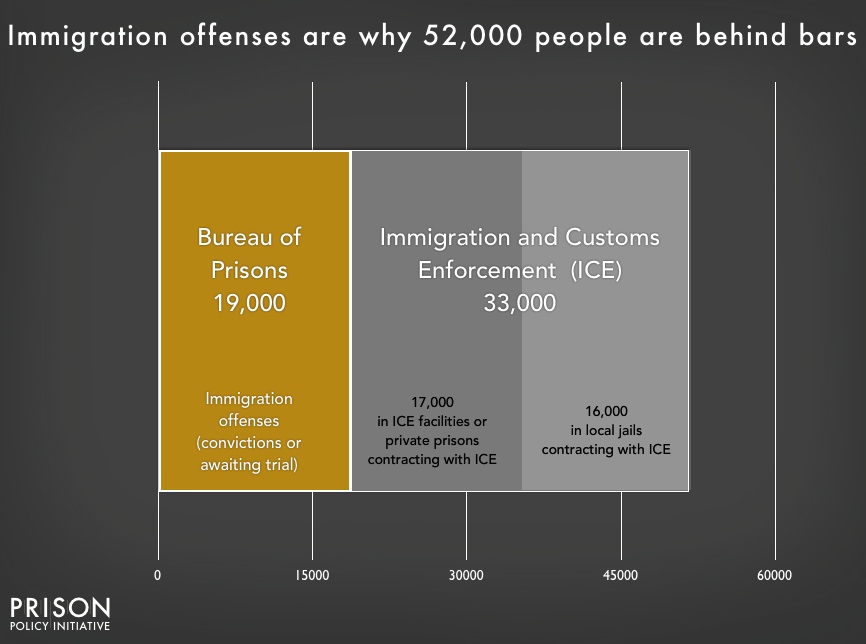
Turning finally to the people who are locked up criminally and civilly forimmigration-related issues, we find that 19,000 people are in federal prison for criminal convictions of violating federal immigration laws. A separate 33,000 are civilly detained by U.S. Immigration and Customs Enforcement (ICE) separate from any criminal proceedings and are physically confined in special immigration detention facilities or in local jails under contract with ICE. (Notably, these categories do not include immigrants represented in other pie slices because of non-immigration related criminal convictions.)
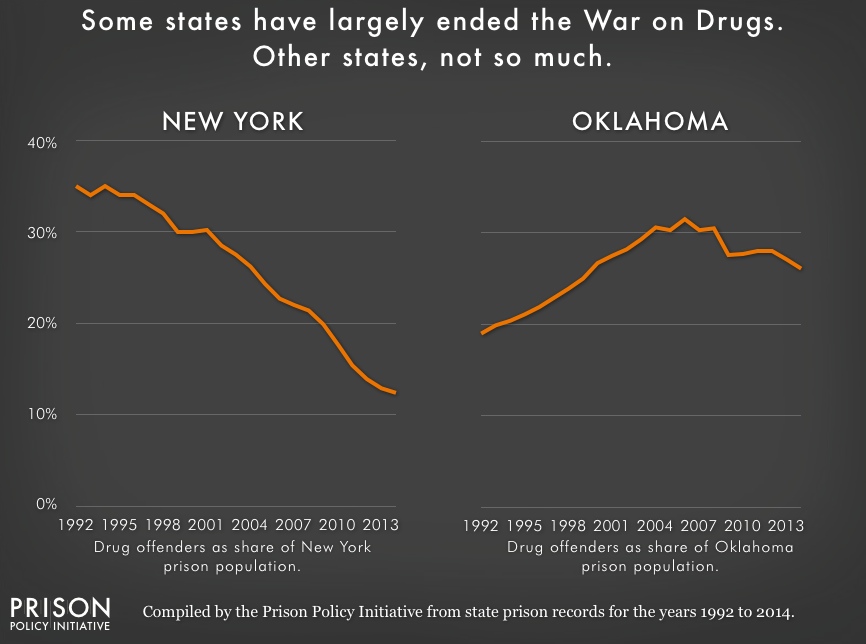
Now, armed with the big picture of how many people are locked up in the United States, where, and why, we have a better foundation for the long overdue conversation about criminal justice reform. For example, the data makes it clear that ending the War on Drugs will not alone end mass incarceration, but that the federal government and some states have effectively reduced their incarcerated populations by turning to drug policy reform. Looking at the “whole pie” also opens up other conversations about where we should focus our energies:
- What is the role of the federal government in ending mass incarceration? The federal prison system is just a small slice of the total pie, but the federal government can certainly use its financial and ideological power to incentivize and illuminate better paths forward. At the same time, how can elected sheriffs, district attorneys, and judges slow the flow of people into the criminal justice system?
- Are state officials and prosecutors willing to rethink both the War on Drugs and the reflexive policies that have served to increase both the odds of incarceration and length of stay for “violent” offenses?
- Do policymakers and the public have the focus to confront the second largest slice of the pie: the thousands of locally administered jails? And does it even make sense to arrest millions of poor people each year for minor offenses, make them post cash bail, and then lock them up when they can’t afford to pay it? Will our leaders be brave enough to redirect corrections spending to smarter investments like community-based drug treatment and job training?
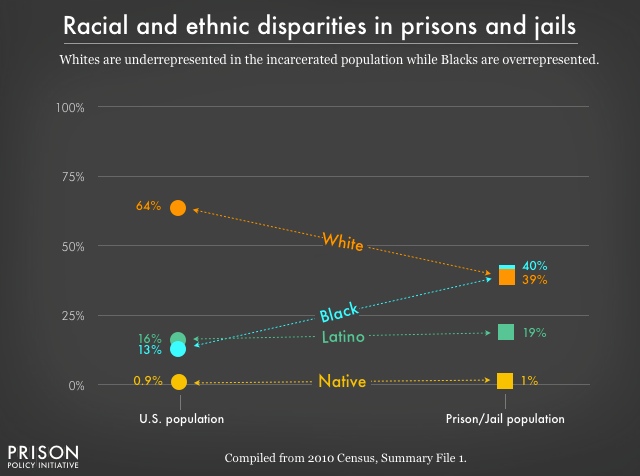
- Can we implement reforms that both reduce the number of people incarcerated in the U.S. and the well-known racial and ethnic disparities in the criminal justice system?
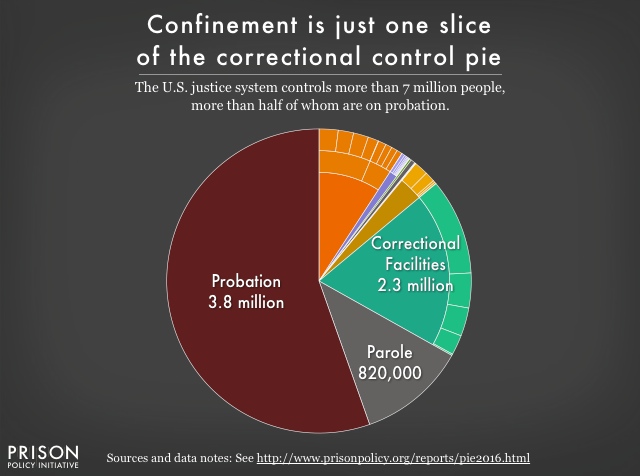
And once we have wrapped our minds around the “whole pie” of mass incarceration, we should zoom out and note that being locked up is just one piece of the larger pie of correctional control. There are another 820,000 people on parole (a type of conditional release from prison) and a staggering 3.8 million people on probation (what is typically an alternative sentence). Particularly given the often onerous conditions of probation, policymakers should be cautious of “alternatives to incarceration” that sometimes widen the net of criminalization to people who are not a threat to public safety.
Now that we can see the big picture of how many people are locked up in the United States in the various types of facilities, we can see that something needs to change. Looking at the big picture requires us to ask if it really makes sense to lock up 2.3 million people on any given day, giving this nation the dubious distinction of having the highest incarceration rate in the world. Both policymakers and the public have the responsibility to carefully consider each individual slice in turn to ask whether legitimate social goals are served by putting each category behind bars, and whether any benefit really outweighs the social and fiscal costs.
We’re optimistic that this “whole pie” approach can give Americans, who are ready for a fresh look at the criminal justice system, some of the tools they need to demand meaningful changes to how we do justice.
This 2016 report was made possible by a generous grant from the Public Welfare Foundation and the contributions of individuals across the country who support justice reform. The infographic slideshows and the graph of correctional control were made possible by Gabe Isman of our Young Professionals Network. Bob Machuga and J. Andrew World helped with design issues, and Alison Walsh helped us gather research. Melissa Sickmund at the National Center for Juvenile Justice and Todd Minton at the Bureau of Justice Statistics expanded our knowledge of agencies’ datasets; and Alex Friedmann, Neelum Arya and Drew Kukorowski provided invaluable feedback on earlier drafts of this report. Any errors or omissions, and final responsibility for all of the many value judgements required to produce a data visualization like this, however, are the sole responsibility of the authors.


No comments:
Post a Comment